Semester One Topics
- Fractions- A review on how to multiply, divide, subtract, and add fractions. This topic was very easy to understand. Most of the problems include finding a common denominator.
- Linear Equations-This was a completely new topic to me, so it was an interesting process to learn. We started with a review on how to plot points and finding the slope of a line. We then moved on to linear equations that include slope and the equation y-y=s(x-x) or the simplified version of the linear equation y=mx+b. We ended this topic with the Plotted Points project below...
- Trigonometry- Within trigonometry we learned the Pythagorean Theorem, which only works on a Right Triangle. And how to solve for a missing angle or length of a side on a triangle. Following the Pythagorean Theorem, we learned Soh Can Toa. Which stands for the following Trigonometry functions, Sine, Cosine, and Tangent. These are functions that help figure out how to solve for the missing angles and sides.
- Ratios and Proportions- We started off with a quick review on how to write ratio's, and then we jumped into find a missing ratio or x. To find x we either had to use cross multiplication or find the common denominator and multiply.
- Sales Tax/Discounts/Percents- This was really an easy subject to understand. It was basically how to find out the sales tax and discounts on items through multiplying the percent by the price of the item. Perfect for the upcoming Holidays!!
- Types of Taxes (Progressive/Proportional/Regressive)- Within this subject we learned about the different types of taxes. One flat tax we learned to do was the Armey-Shelby Tax Proposal. We also learned how to calculate our taxes through our gross income and how to find our net-income based on how much money in tax dollars you have to pay. This was created off of the 2011 US Progressive tax brackets that people use to pay off their taxes with.
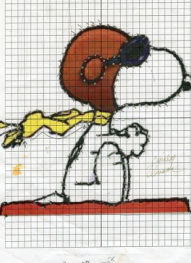
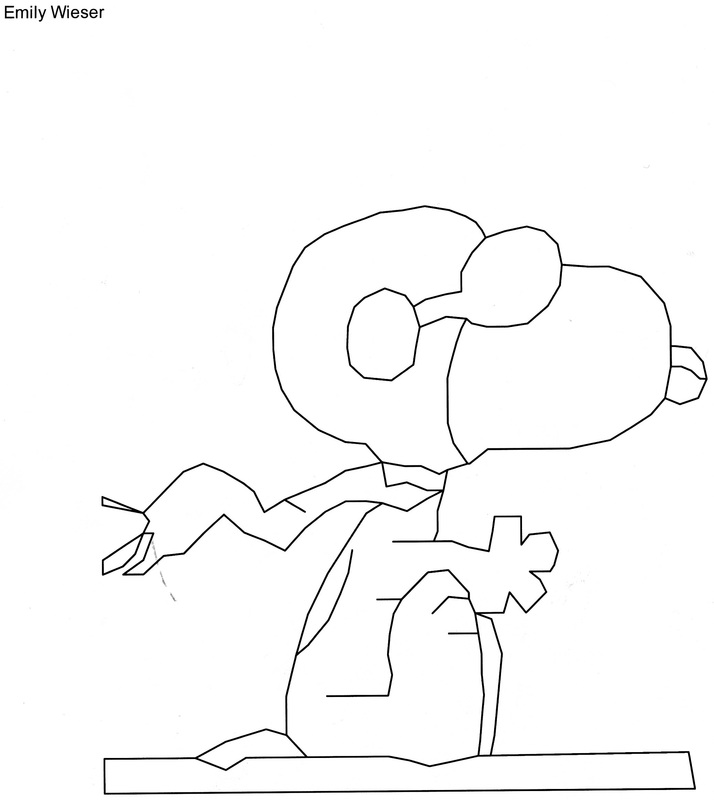
Plotting Points and Replicating an Image- This project was withing the subject of linear equations. We first had to find a picture that we would like to replicate, one that would be easy. We printed this picture or image onto graph paper and then started the long, tedious process of plotting out and right down the points. Along with this, we had to solve 25 linear equations that came within the points we had plotted. Once we were done plotting the points, we then used a program call Geogebra and entered the points into the system it used. You then could connect the points on the software. The picture to the far right is my end result of the project, and the picture to the left is the sheet and image I plotted my points off of.
|
|
Animas High School 3206 North Main Street Durango, CO 81301
[email protected]
[email protected]
